
R&D credit methodology for auditors
This document outlines NeoTax’s R&D Credit Methodology for auditors, detailing how our AI-driven system identifies eligible business components, evaluates projects against the 4-part test for R&D tax credit qualification, and allocates R&D effort based on objective ticket data rather than estimates.
The methodology leverages project management system data to create transparent, defensible R&D allocations with comprehensive documentation of all development activities performed during the tax year.
Table of Contents
Business Component/Project Identification
Neo.Tax automatically identifies and categorizes R&D tax credit eligible business components by integrating directly with an entity’s version control and project management systems. This AI-driven approach eliminates the subjectivity of traditional interview-based methodologies while providing comprehensive documentation of all development activities performed during the tax year.
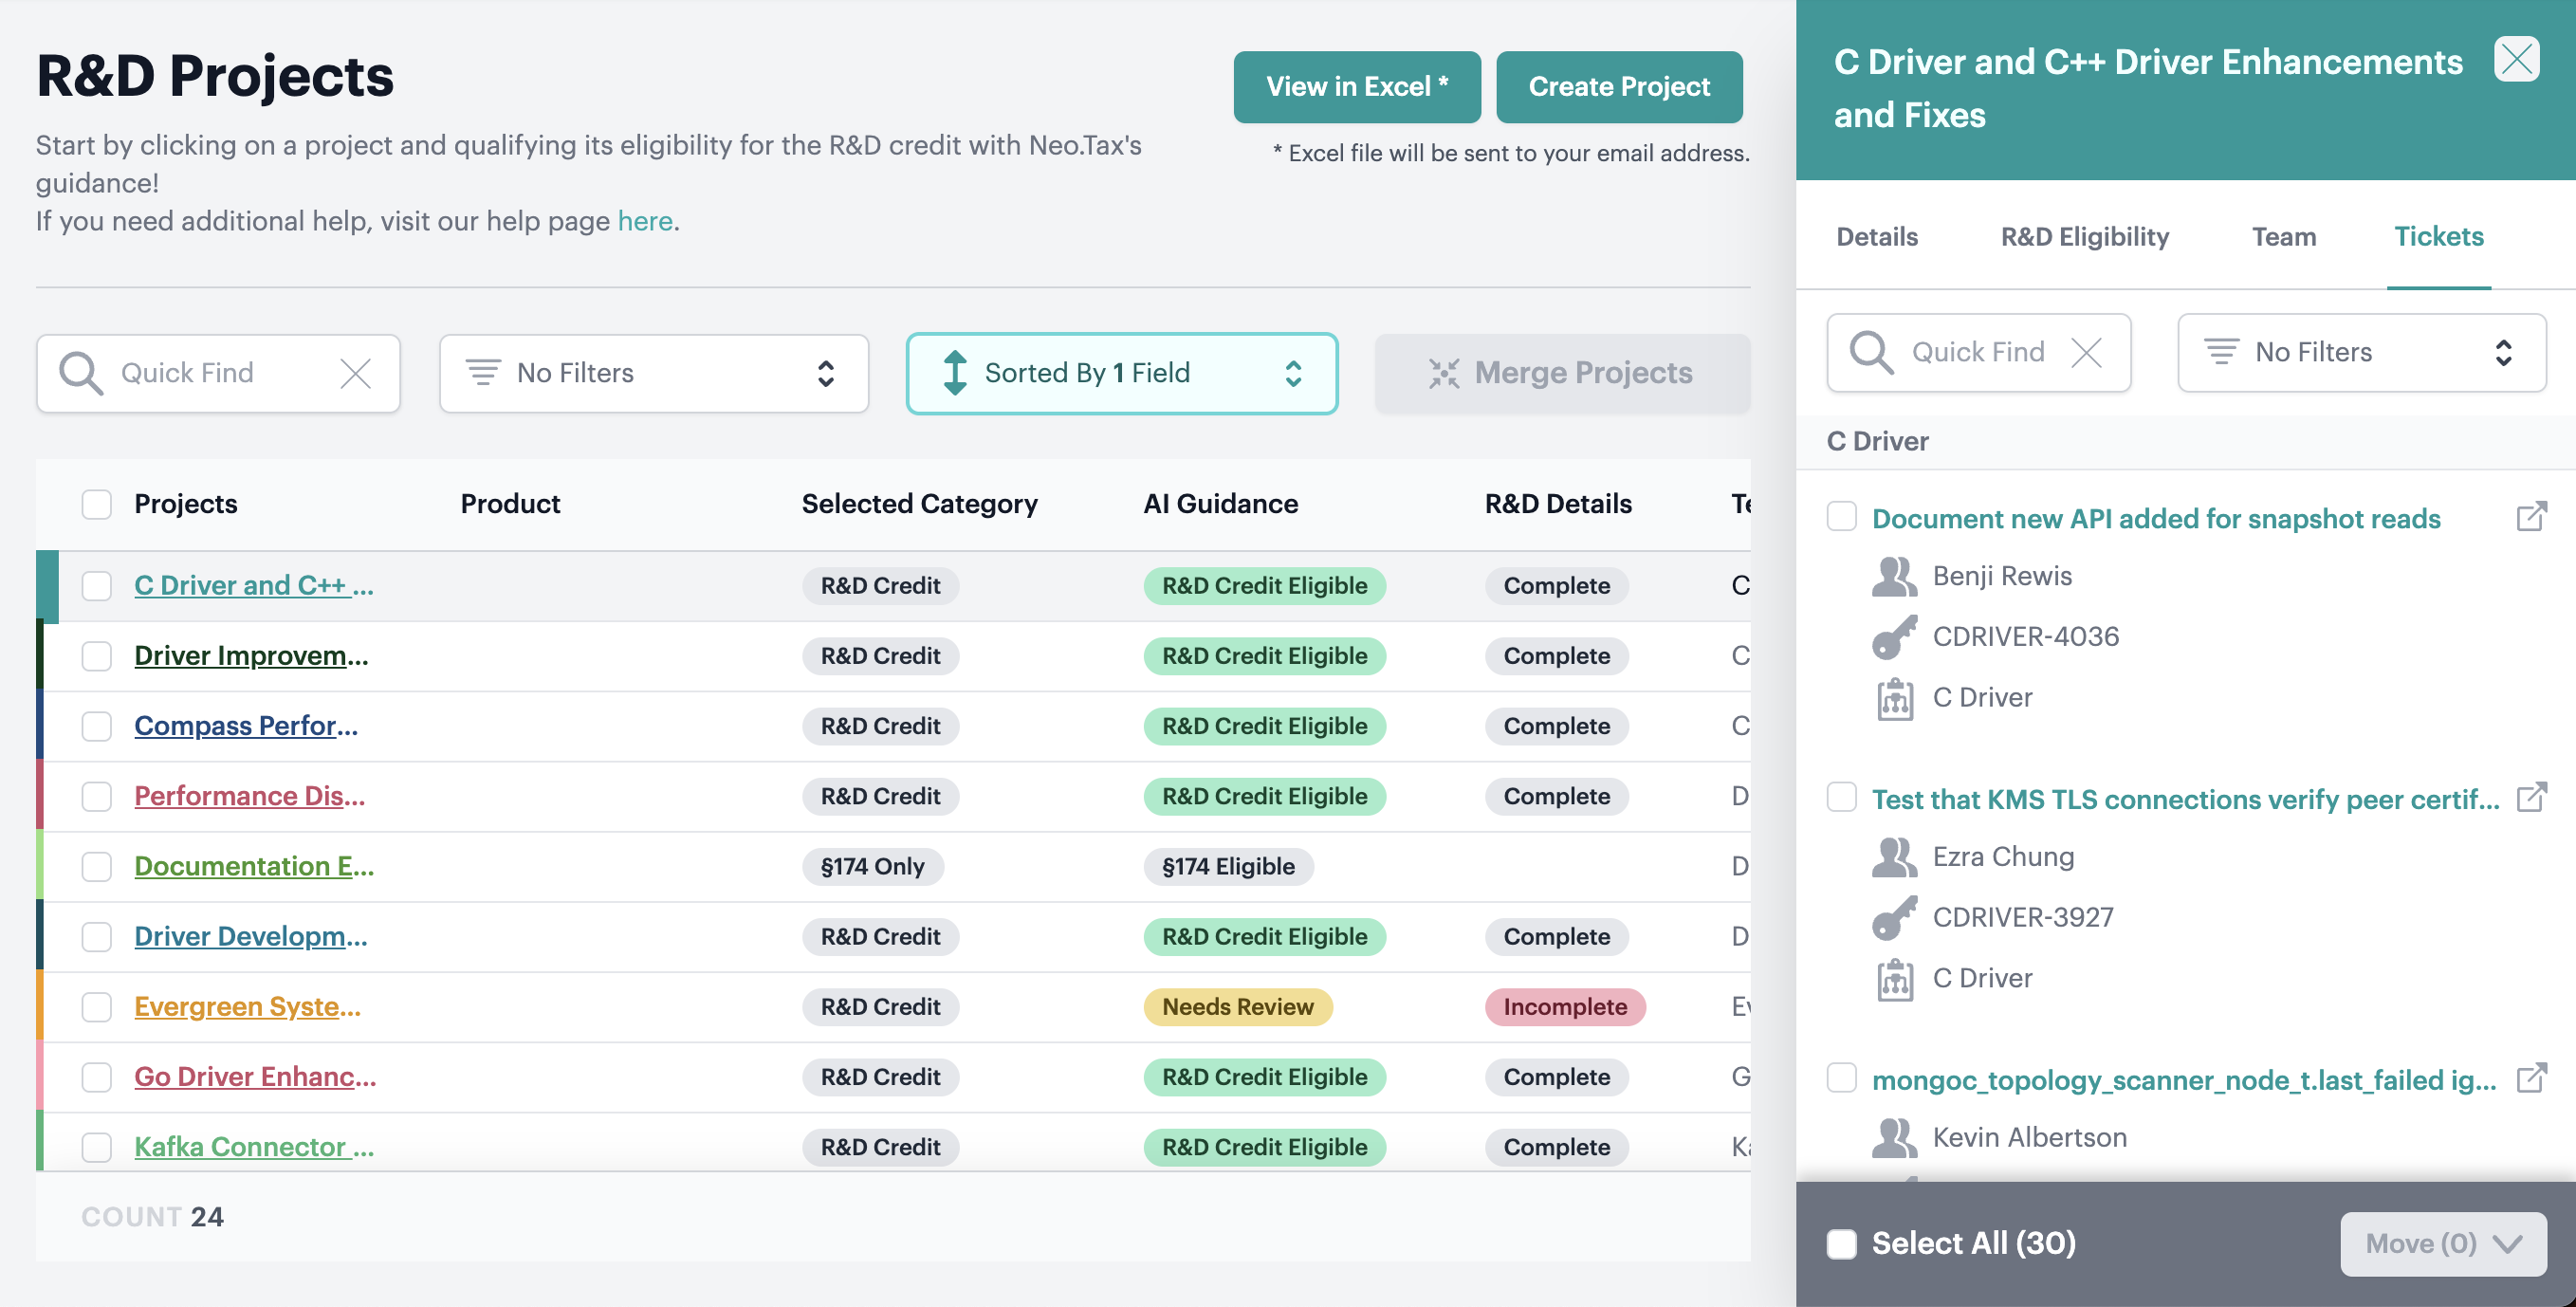
Follow along in the R&D Export sheets:
- Projects = Project names, descriptions, and qualified $
- Tickets by Project by Person = Shows the categorization of each ticket to project
How it Works Neo.Tax connects to project management systems via API and retrieves all tickets worked on during the tax year.
Using our proprietary AI technology, the system analyzes this granular data to automatically generate a comprehensive list of all projects the company worked on (qualified and non-qualified) then summarizes the project into a detailed descriptions derived from the actual development work performed.
Each individual ticket is categorized to its appropriate business component using first the company’s project management system object hierarchy where available, then using deep learning and word embedding technology that groups similar work together based on the keywords and phrases. This process converts ticket metadata into numerical representations, enabling precise matching between tickets and business components without human interpretation bias.
Rich Data Ingestion The system captures detailed information from the company project management systems including:
- Ticket titles, descriptions, dates, users, teams, hierarchy like Epics/Initiatives, and other metadata
- User information including team assignments and project involvement
Quality Assurance
- Data cleaning removes duplicates and filters noise
- Dynamic granularity adjusts to company size from startup to enterprise
- Validations at every step to ensure all tickets are accounted for and all work is evaluated
R&D Qualification
Neo.Tax systematically evaluates each project/business component against the 4-part test for the R&D tax credit, analyzing the project summaries and individual ticket details to ensure comprehensive assessment.
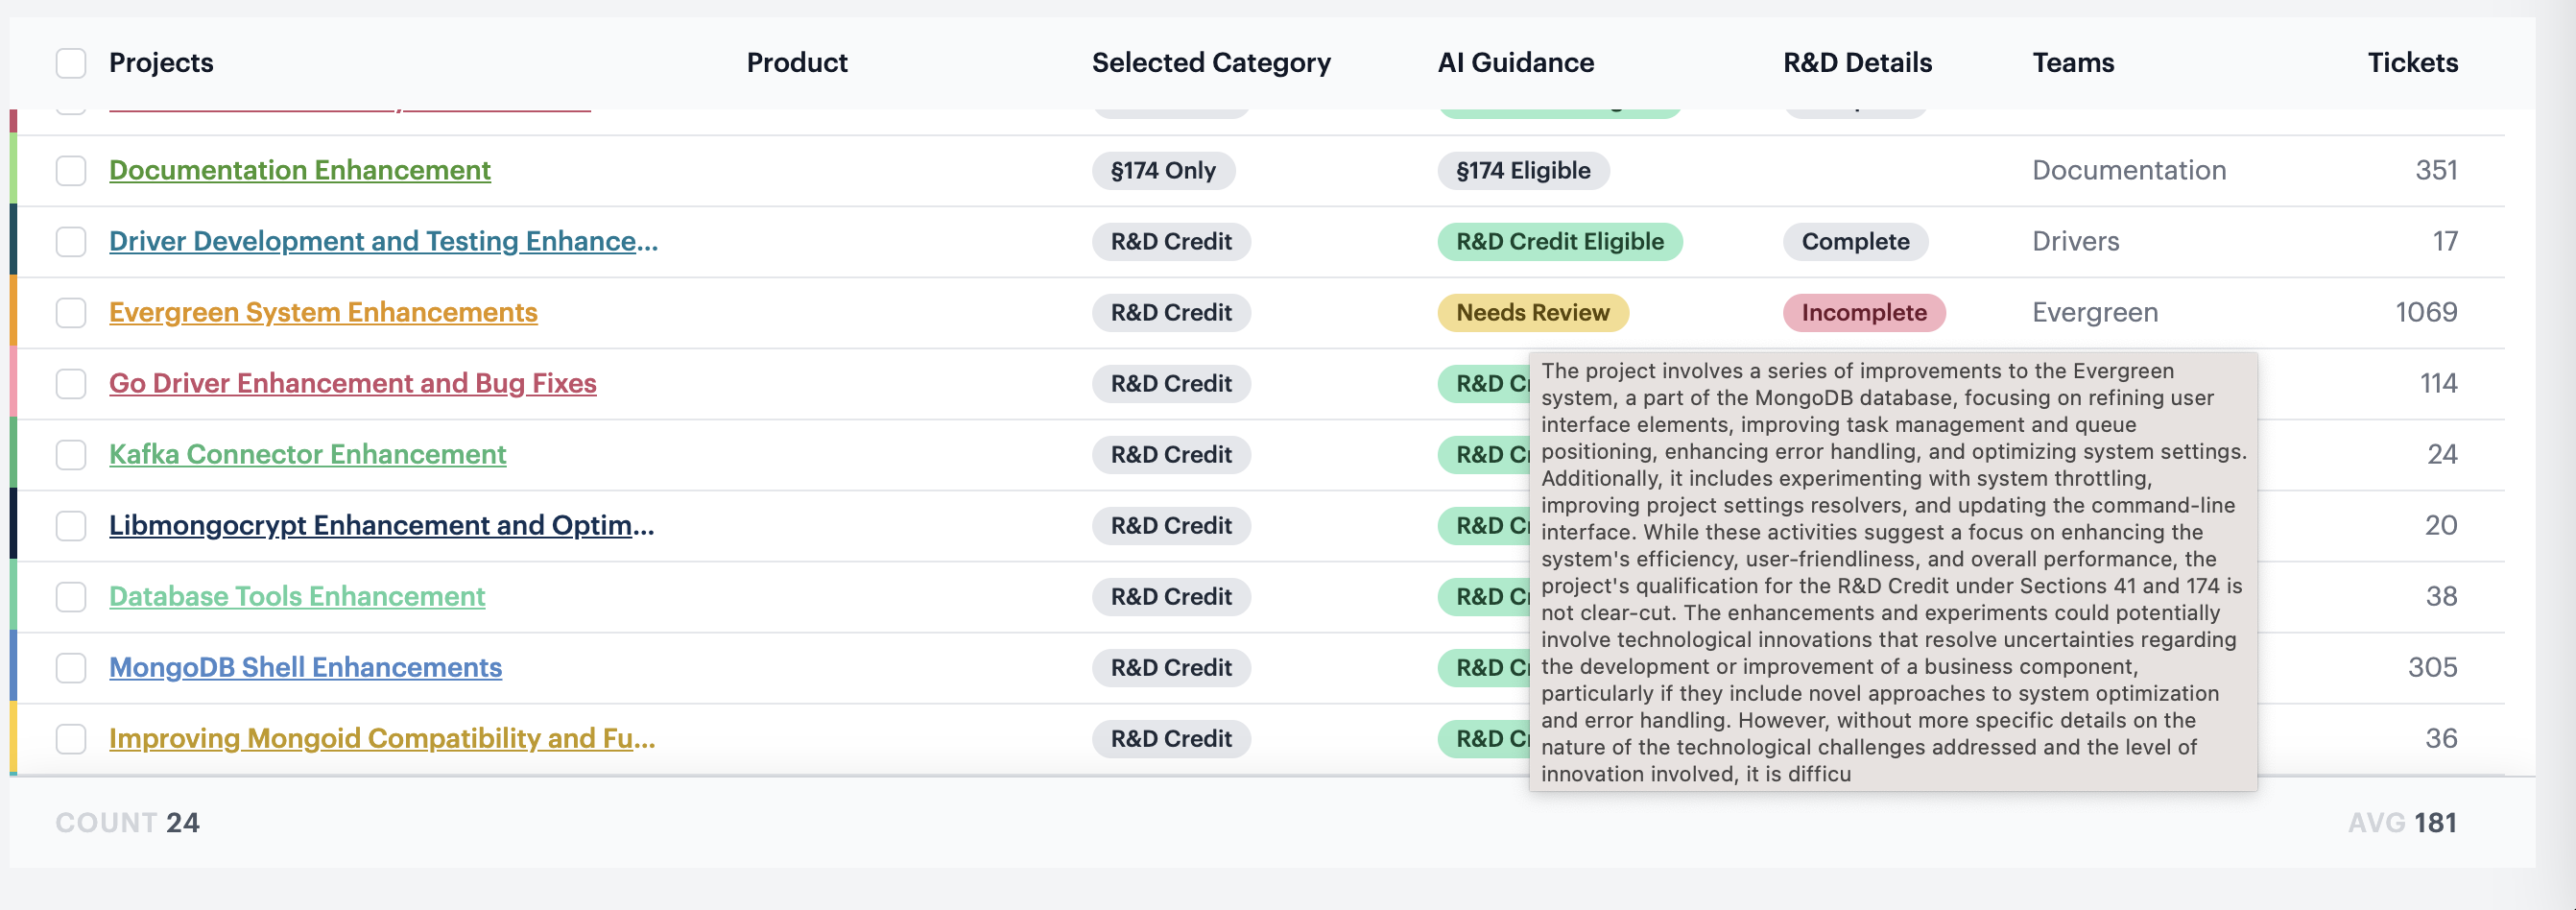
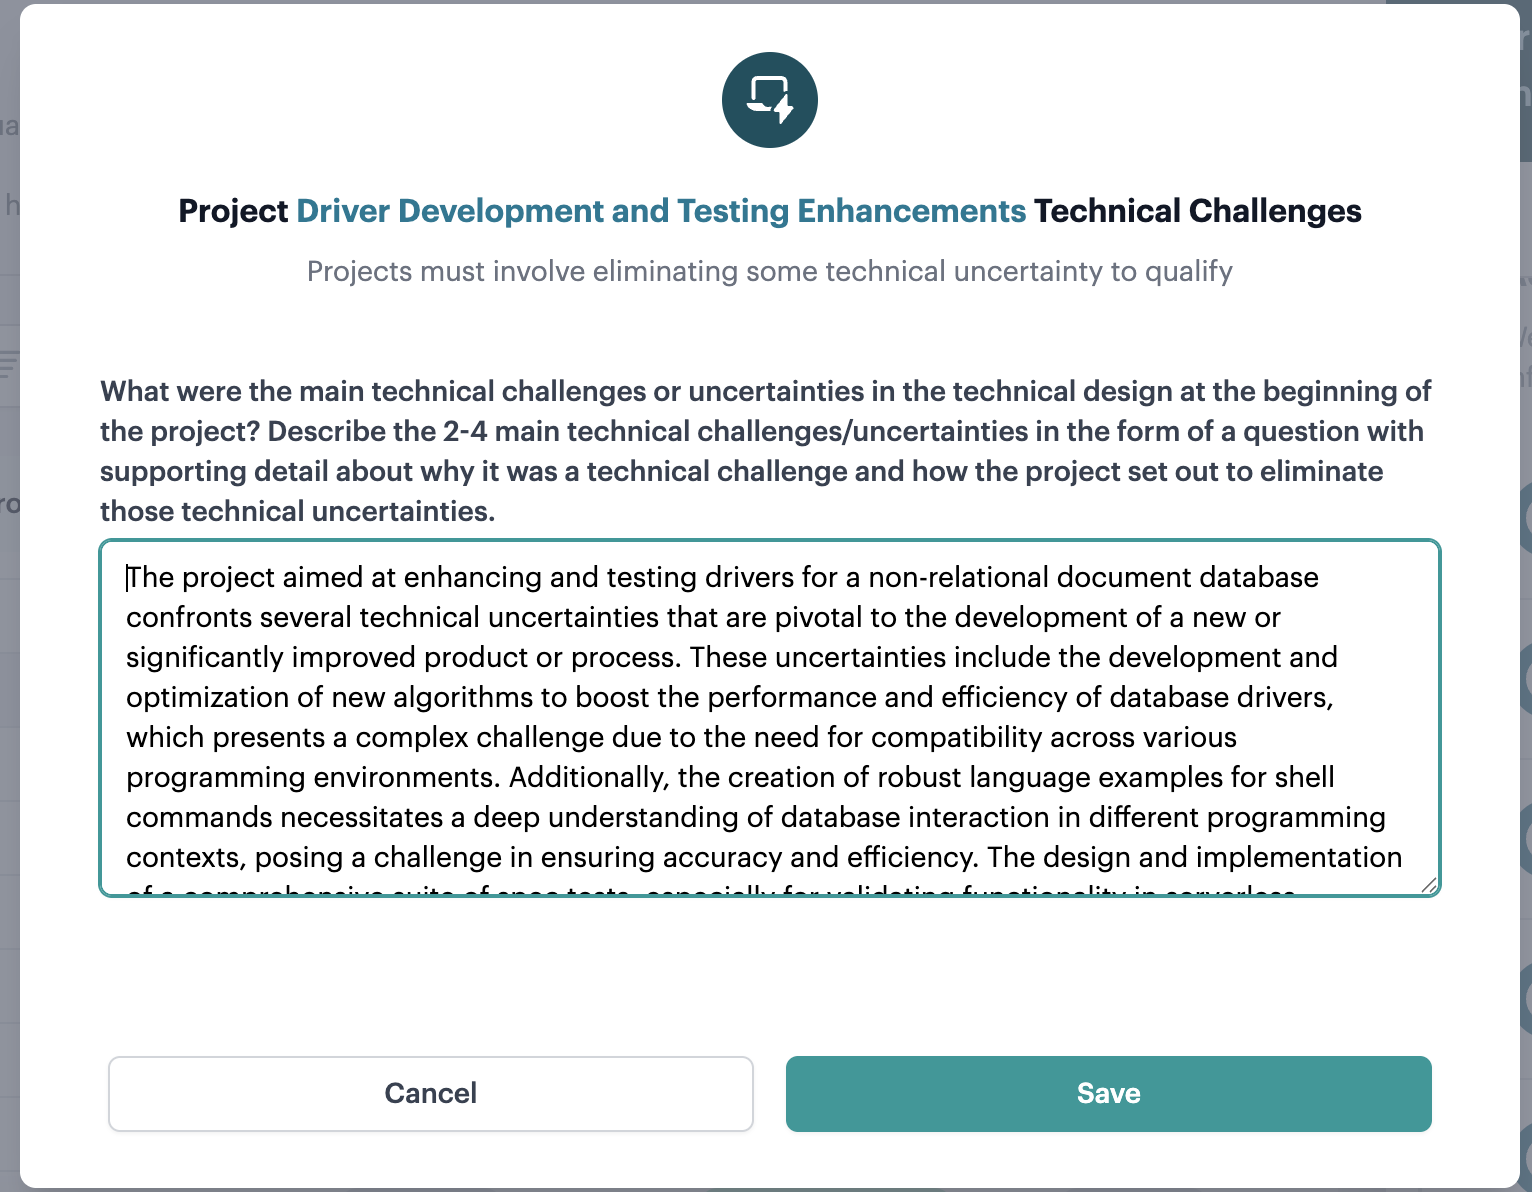
R&D Export sheet:
- Projects R&D Details = Project qualification, Reasoning, Project Narratives
How it Works
1. Technical in Nature Test
- Evaluates each individual ticket within the project for technical content
- Determines if “substantially all” of the project activities are technical in nature
- Uses ticket descriptions, code changes, and task classifications for assessment
2. Qualified Purpose Test
- Analyzes project summaries against tax rules and regulations for qualified purposes
- Evaluates if substantially all project activities meet qualified purpose requirements
- Automatically flags uncertain or mixed-purpose projects for human review
- Internal Use Software IUS projects are evaluated against the additional 3 steps.
3. Technical Uncertainty Test
- Searches ticket details to identify significant technical uncertainties encountered
- Documents specific uncertainties and challenges faced during development
- Maps uncertainty resolution activities throughout the project lifecycle
4. Process of Experimentation Test
- Examines tickets to determine if projects followed iterative development approaches
- Identifies experimentation activities, testing phases, and iterative improvements
- Documents systematic approaches to resolving technical uncertainties
Quality Control: Projects with ambiguous qualification status are automatically flagged for expert human review, ensuring accurate classification while maintaining audit trail documentation.
R&D Allocation
Most R&D credit calculations rely on estimates, surveys, or manual time tracking—all prone to errors and IRS scrutiny. NeoTax uses the existing ticket data to create an objective, defensible allocation bottoms-up based on the actual work done.
This approach aligns with IRS expectations for R&D credit documentation:
- Based on contemporaneous records
- Systematic and consistent methodology
- Clear audit trail from raw data to final allocation
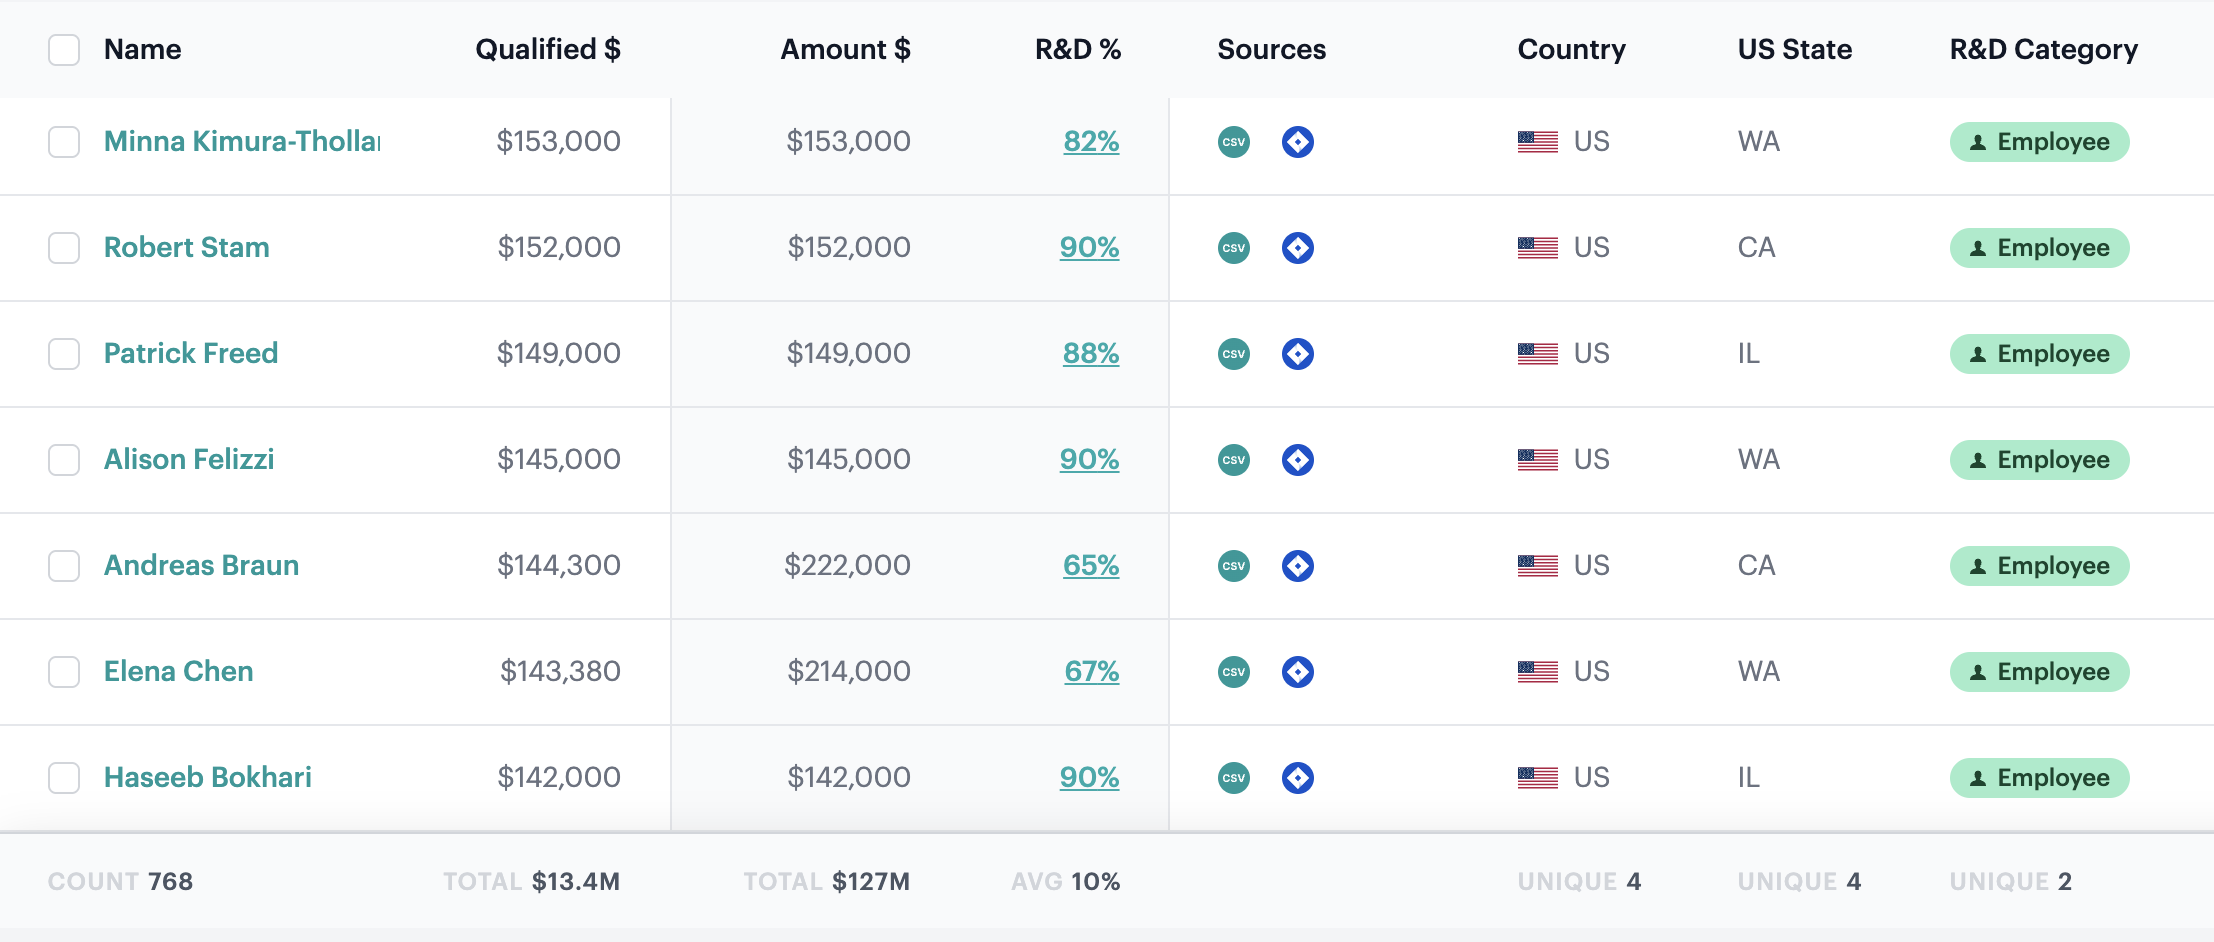
Employee allocation by project/business component from the ticketing data
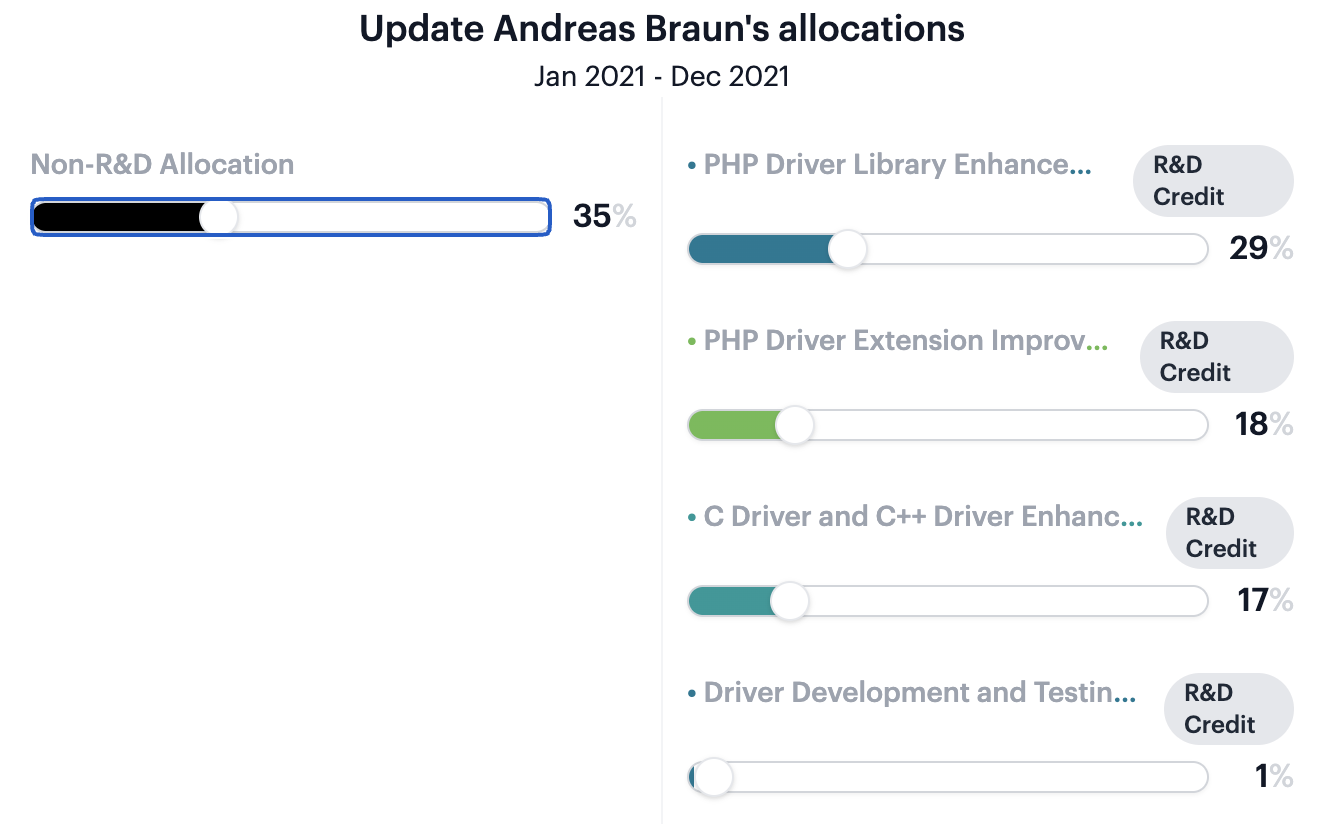
R&D Export sheet:
- Expenses by Project (Credit) = Percent of time by Project
- Expense $ Raw = Qualified $ by Expense. Pivot this to get by department/entity etc totals
Our Process
Step 1: Calculate effort for each task We analyze the ticketing data using three signals:
- Timeline data (start, progress, review, completion dates)
- Task complexity (bug fix vs. architecture design)
- Individual work patterns (normalized to account for different working styles)
Step 2: Allocate effort by project
- Sum effort across all tasks in each project
- Calculate each project’s percentage of total effort
- Apply R&D qualification at the project level
The resulting R&D percent is the value shown in the R&D Report > Expenses by Project (Credit) sheet and the Wages page in the application.
See Complete Example below.
Verification Steps - R&D % by project
To recalculate the % by Project, go to the R&D Export > Tickets by Project by Person sheet.
Then pivot with:
Columns: Project (Name) Rows: Assignee
Values: Sum of Effort (Days) > Calculate as % of Row total
This should match the R&D Report > Expenses by Project (Credit).
Expect 1-5 percentage point differences due to rounding.
FAQ
Your allocation is based entirely on contemporaneous business records—the same ticket data you use to manage projects. No subjective estimates or after-the-fact reconstructions.
“How can I verify the calculation?” Every step is transparent and reproducible:
- Individual task efforts are visible in the Ticketing tab
- Project allocations can be cross-checked using the pivot table method described below
- The final R&D percentage is simply the sum of qualified project percentages
“What about people with different numbers of tickets?” Our normalization process accounts for individual work patterns. Someone who creates 50 small tickets and someone who works on 5 large features both get accurate allocations based on actual effort, not ticket count.
“What about job title differences?” The base calculation treats all qualified technical work equally based on the task complexity and the timeline data in the contemporaneous ticketing data. This produces a clean, auditable quantitative effort approach instead of mixing quantitative data with job-title assumptions assumptions.
You can layer in role-based adjustments afterward if needed.
Example Engineer:
- Name: Jason Smith
- Title: Software Engineer
- R&D Allocation: 95%
Projects:
In FY 2024, Jason worked on these six projects:
| Project | # of Tickets/Pull requests | Qualified for R&D? |
|---|---|---|
| Hardware Enhancements | 327 | Yes |
| Billing System Overhaul | 12 | Yes |
| Platform Security and Feature Development | 1 | Yes |
| OAuth Integration | 8 | No |
| Model Interface Refinement | 1 | No |
| UI and UX Enhancements: Emojis | 1 | No |
We matched all tickets Jason worked on to a project and evaluated each project against the Four-Part Test to determine qualified R&D projects. This allows us to determine when Jason was actively working on qualified research.
The tickets that are part of the Hardware Enhancements, Billing System Overhaul, Platform Security and Feature Development projects will count towards Jason’s qualified time.
Activity ⇒ Effort
For each ticket, we extract a start date and an end date directly from the source system, providing a transparent, date-stamped audit trail. This duration provides the anchor for the ticket.
We then calculate the number of “Effort Days” for each project based on the number of days that there was an active ticket for that project and the ticket scope.
- If all the tickets for a given working day are related to a single project, then that project gets 1 day of effort.
- If on a single day, there are multiple tickets related to different projects, then the day’s effort is allocated proportionately to the number of tickets open on that day and their scope.
- This is based on the timestamps of the tickets from the underlying project system rather than assuming equal weight per ticket.
We then use a Machine Learning model to account for edge cases in the underlying data like when a large ticket is worked on intermittently or multiple smaller tickets are handled on the same day.
A ticket’s effort grows with the calendar time and technical scope it occupies, so longer, more complex work streams naturally outweigh quick fixes. This mirrors the reality of engineering effort while remaining fully traceable to source‑system timestamps.
The following chart shows the number of tickets that were actively worked on by week. This number is calculated first using the raw timestamps in the source system and then adjusted by the Machine Learning model.
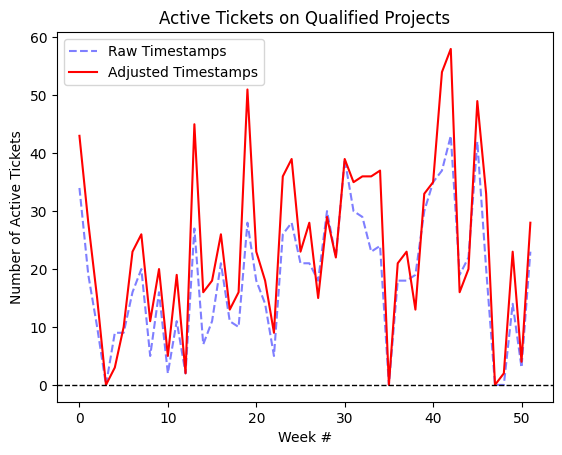
This accounts for the fact that there is some amount of time spent working on the ticket before it is committed, which is when the ticket is first registered in the system.
With the complete set of tickets and their active period, we then sum up the Effort totals. We allocate Jason’s time per project proportional to the sum of effort in each project. For ease of analysis, we round the percentages in a way that minimizes the total rounding deviation and ensures effort adds up to 100%.
| Project | Effort Days | Qualified | % of Total | Rounded % |
|---|---|---|---|---|
| Hardware Enhancements | 188.69 | Yes | 93.35% | 93% |
| Billing System Overhaul | 5.55 | Yes | 2.75% | 2% |
| Platform Security and Feature Development | 0.7 | Yes | 0.35% | 0% |
| OAuth Integration | 5.11 | No | 2.53% | 2% |
| Model Interface Refinement | 1.83 | No | 0.91% | 1% |
| UI and UX Enhancements: Emojis | 0.25 | No | 0.12% | 0% |
| Total | 202.13 | 100 |
Out of Jason’s total effort:
93% + 2% + 0% = 95%
was spent on qualified projects.
This method uses the real-world contemporaneous timestamp data to approximate effort on a day-by-day basis and allocate time accordingly, instead of less accurate methods like assuming equal weight per ticket or using after-the-fact estimates.
Finally, we multiply this by Jason’s W-2 Box 1 wages for the year to determine the amount of qualified expense.